


Next: Analysis
Up: ke3
Previous: Experimental setup
During physics runs in November-December 1999 and March-April 2001,
206M and 363M events were logged on DLT's. This information is supported
by about 100M MC events generated with Geant3 [10]. MC generation
includes realistic description of the setup: decay volume entrance windows,
track chambers windows, gas, sense wires and cathode structure,
Cerenkov counters mirrors and gas, shower generation in EM calorimeters etc.
The usual first step of the data processing is the EM calorimeter
calibration, using special runs with 10 GeV electrons; track system
alignment, HCAL and guard system calibration with muon beam runs.
The data processing starts with the beam particle reconstruction in
 , then the secondary tracks are looked for in
 ;
;
 ;
;
 and events with one good negative track are selected.
The decay vertex is searched for, and a cut is introduced on the
matching of incoming and decay track. The next step is to look for
showers in
and events with one good negative track are selected.
The decay vertex is searched for, and a cut is introduced on the
matching of incoming and decay track. The next step is to look for
showers in  calorimeter. A method of shower parameters reconstruction
based on the MC-generated patterns(
calorimeter. A method of shower parameters reconstruction
based on the MC-generated patterns(
 patterns) of showers
is used. The matching of the charged track and a shower in is done
on the basis of the difference between the track extrapolation and the
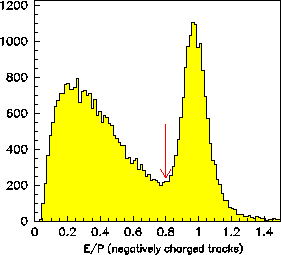
shower coordinates. The electron identification is done using E/P ratio-
of the energy of the shower associated with the track and the track momentum,
see Fig.2.
patterns) of showers
is used. The matching of the charged track and a shower in is done
on the basis of the difference between the track extrapolation and the
shower coordinates. The electron identification is done using E/P ratio-
of the energy of the shower associated with the track and the track momentum,
see Fig.2.
Figure 2:
The E/p plot- the ratio of the energy of the associated
cluster in ECAL to the momentum of the charged track. The arrow shows the
cut used for the electron separation.
 |
The selection of events with the two extra showers results in
 spectrum shown in Fig.3.
Figure 3:
The  mass spectrum for the events with
the identified electron and two extra showers.
mass spectrum for the events with
the identified electron and two extra showers.
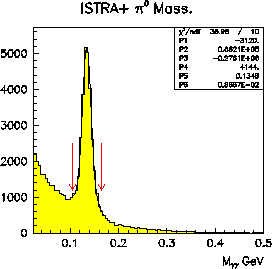 |
The  peak
has a mass of
peak
has a mass of
 , and a resolution of 8.6 MeV.
Another important variable for the
, and a resolution of 8.6 MeV.
Another important variable for the
 selection is the missing mass squared-
 ,
where P are the corresponding four-momenta, see Fig.4. The cut is
,
where P are the corresponding four-momenta, see Fig.4. The cut is
 GeV
GeV .
.
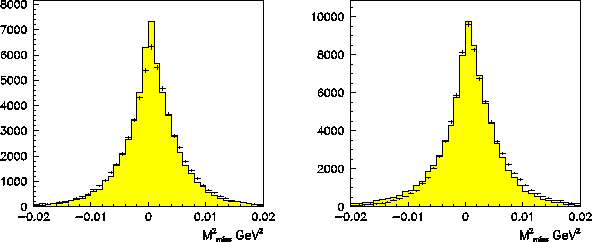
Figure 4:
The missing four-momentum squared
for the selected events for 1999 run (left) and 2001 run (right). The
points with errors are the data, the histogram- MC.
 |
The futher selection is done by the requirement that the event passes 2C
 fit.
At the same time, similar 2C fit
fit.
At the same time, similar 2C fit
 should fail..
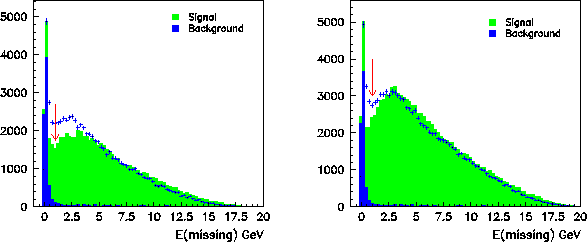
The missing energy
should fail..
The missing energy
 after this selection is shown
in Fig.5
The peak at low
after this selection is shown
in Fig.5
The peak at low  corresponds to
the remaining
corresponds to
the remaining
 background. The corresponding
cut is
background. The corresponding
cut is 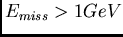 .
The surviving background is estimated from MC to be less
than
.
The surviving background is estimated from MC to be less
than  .
.
Figure 5:
The missing energy for the  events, for 1999 run (left)
and 2001 run (right). The points with errors are the data, the histograms- MC.
The dark(blue) peak at zero value corresponds to the
MC-predicted
events, for 1999 run (left)
and 2001 run (right). The points with errors are the data, the histograms- MC.
The dark(blue) peak at zero value corresponds to the
MC-predicted
 background.
The arrow indicates the cut value.
background.
The arrow indicates the cut value.
 |
The detailed data reduction information is shown in Table.1.
Next: Analysis
Up: ke3
Previous: Experimental setup
Alexander V.Inyakin
2002-03-27